06. August 2015
This article is Part 2 of a whole series called Xcode Server Tutorials. Check out Part 1 first if you haven't already. New posts are always tweeted by me (@czechboy0.dev) on Bluesky.
Ok, time to stop celebrating your success from Part 1 where you got to install Xcode Server and created your very first Bot, which checked out and tested my demo project from GitHub. I left you just after you created your Bot, which, as you probably saw, triggered the first Integration of your Bot. Today, we will look at what this means and how to take advantage of Xcode’s beautiful visualizations of Integration results.
Objective of this article
We will take a look at how to look at Bots and Integrations in Xcode and we will explore Integration results in detail.
1. Integration Results
In the Report Navigator, which we discovered in Part 1, take a look at your recently-created Bot. Click on the disclosure triangle on its left to reveal the list of Integrations (just one right now). Now click on the running Integration under the Bot and you should see something like this:
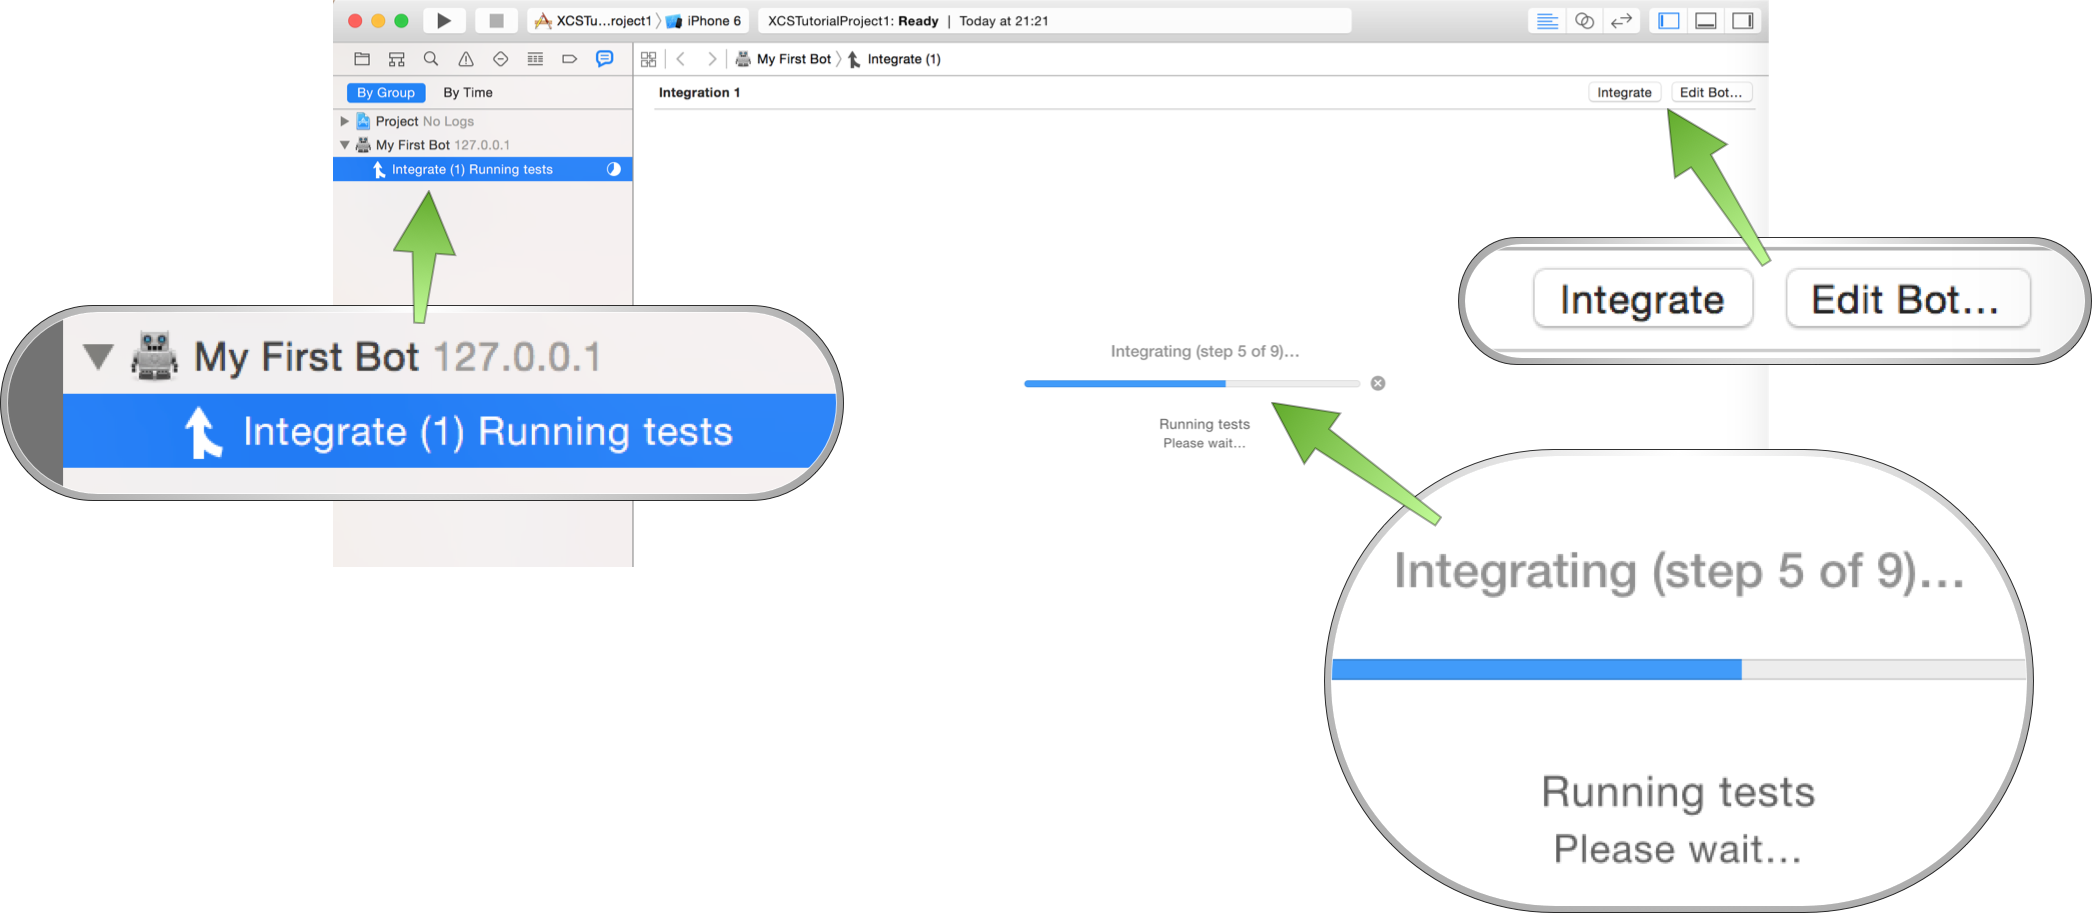
In the left bar, you have a list of Bots and their Integrations. If you click on a running Integration, you will see its progress and a cancel (the little x) button. At the top right, you can start another Integration by clicking “Integrate” and edit the Bot’s configuration. Which configuration? The one we explored in detail in our first article.
Once your Bot finishes running (which should be a matter of one or two minutes), you will be presented with a nice summary of how the Bot did.
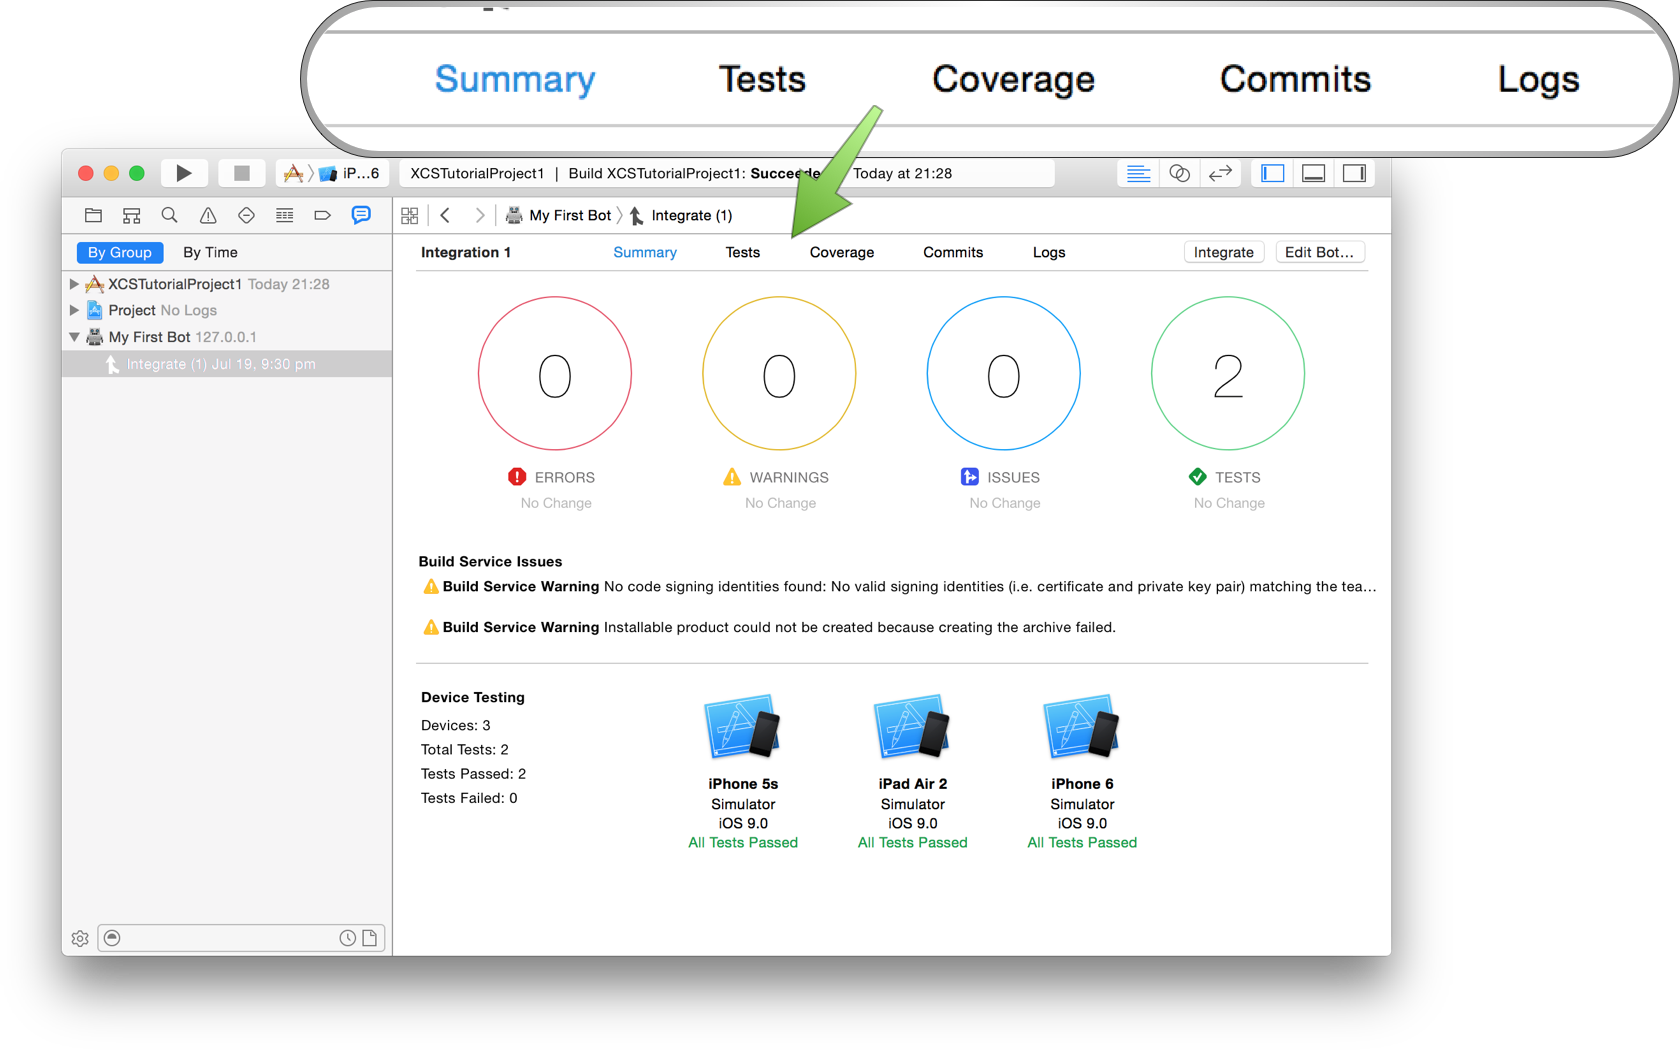
You can see the number of errors, warnings, analyzer issues and tests ran/failed. Underneath, you will see any additional messages from Xcode Server (we will go into what these two build service warnings mean and how to fix them in a future article) and at the bottom you have a test result for each device.
If you look at the top, you can see that this is just one of five sections in the Integration results area - the Summary tab.
Let’s click on Tests now to see which tests actually ran.
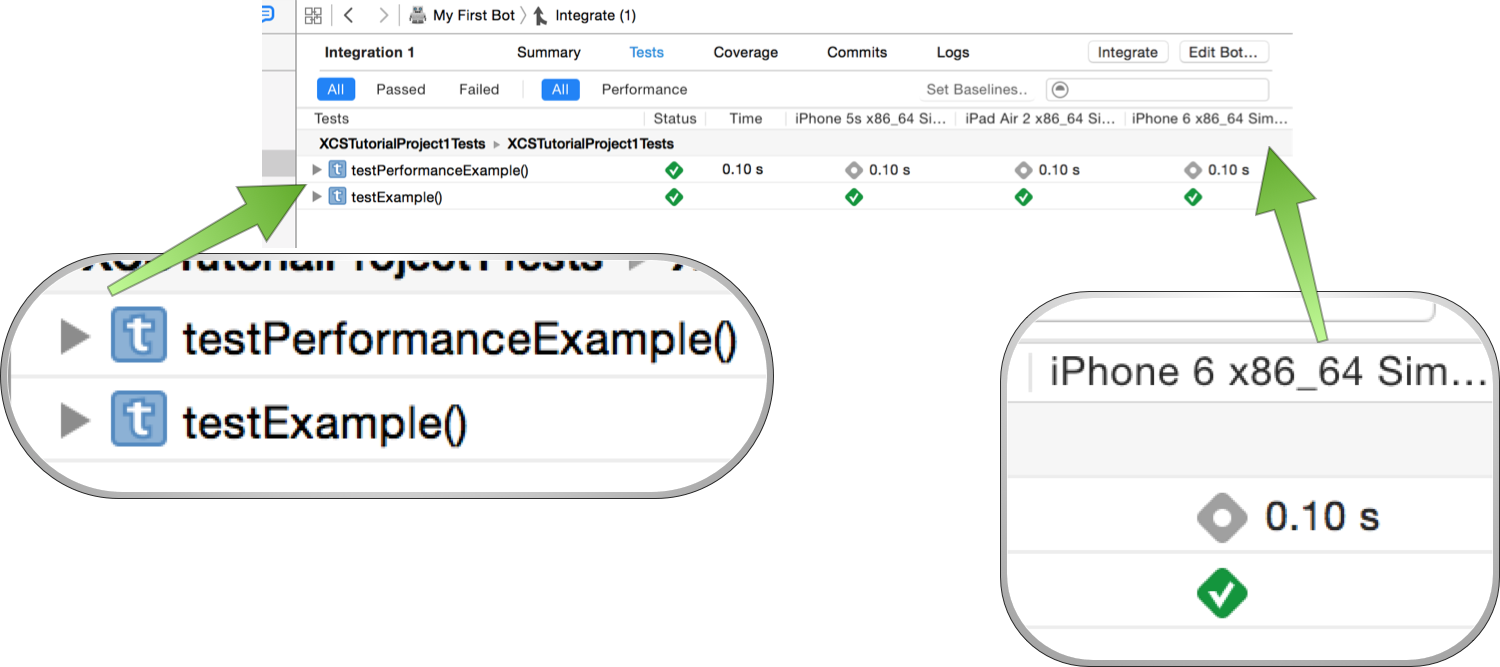
The Tests section is probably my most-visited tab. It shows you which tests ran (left) in a grid of tests vs. devices. On the right you can see that the iPhone 6 Simulator succeeded testExample() and took 0.10s to run a performance test called testPerformanceExample().
Performance tests actually run the code 10 times and then statistically process the results, giving you the mean (average) value with its standard deviation (how much the runs varied).
At the top, you can see filters All, Passed and Failed, and All vs Performance which are self-explanatory. On the right you can even search tests by name and set performance tests’ baselines (which are useful when you want your test to fail if your code gets slower than the baseline). With performance test baselines, you can introduce a “no regressions” policy in your team.
Let’s look at Coverage now to see how much of our code is actually covered by tests.
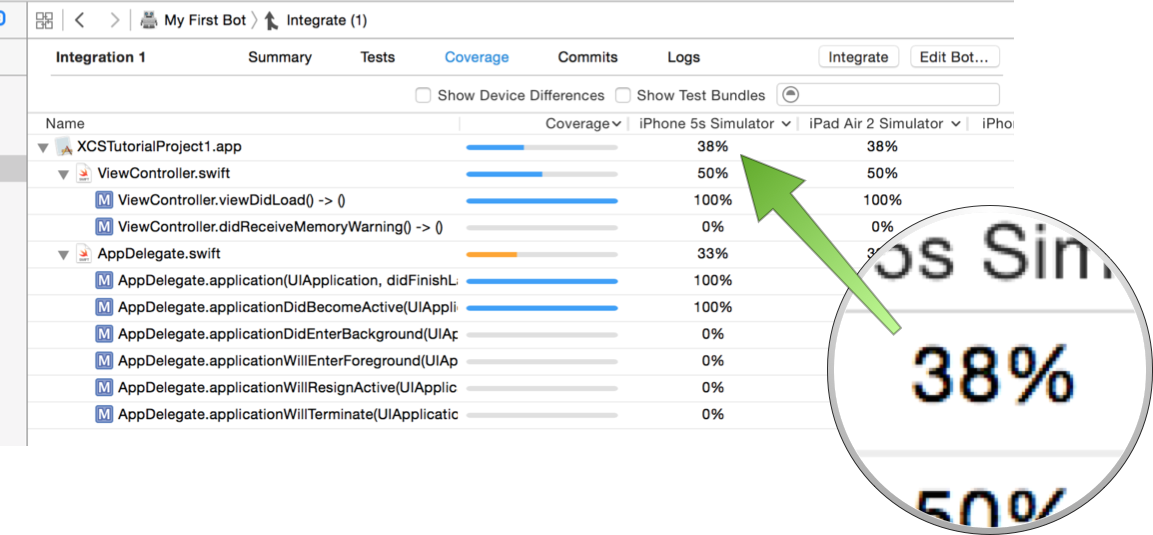
38%, turns out. Here you get to take full advantage of a new Xcode 7 feature called Code Coverage. It tells you, per target all the way down to per method, how well you’re testing your code. Note that this seems to be runtime code coverage. When this feature is on, your test traces every method call, so that you can even see which code path inside of a method has not been taken in tests. This is much better than all the other static code coverage analyzers out there, because they just can’t give you nearly this amount of detail.
Since your code might take different paths on different devices, even code coverage is reported separately per device. So to be correct, I should have said that our coverage is 38% on the iPhone 5S Simulator.
This feature gives you brilliant insight into your own code and how well you’re actually testing it. If you take time to go through the report every now and then, you’ll save hours by knowing where your time is required most. Even in my open source projects, this feature has been a great guide when deciding what we still need to write tests for.
Let’s see Commits now.
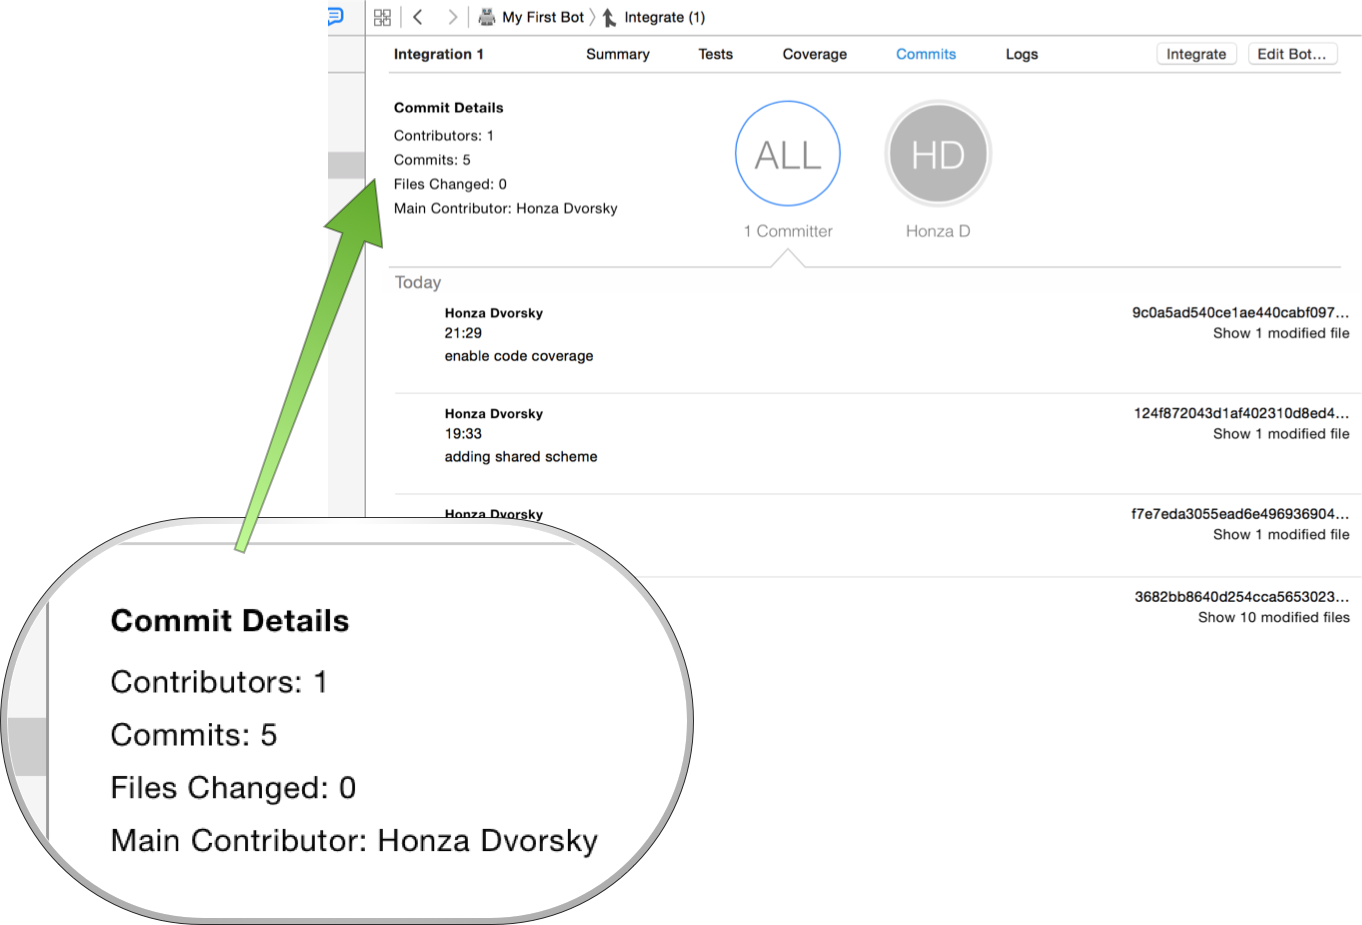
The Commits section gives you an overview of what commits have been pushed since the last Integration. This makes it the perfect tool when your build breaks and you need to find out who actually broke it (not for finger-pointing, obviously, just to be able to better diagnose the problem) and what broke. This overview also tells which files were affected by the recent commits.
And last, but not least, the Logs section.
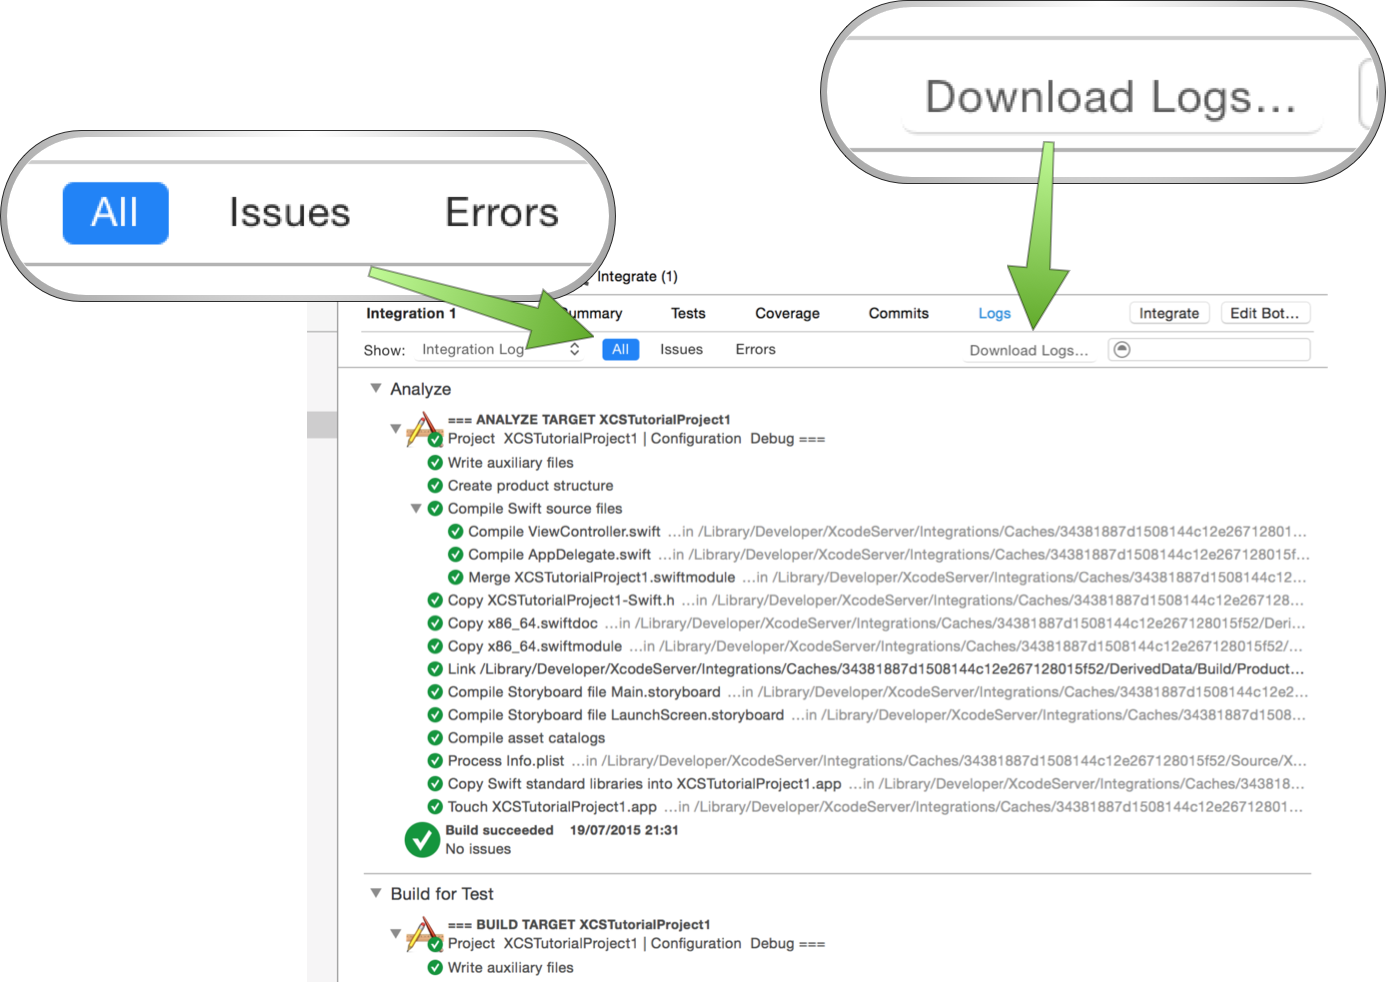
The Logs section will prove very useful when diagnosing a build error or a failed test. Here you can find the logs for everything that Xcode Server did on your behalf. The interactive list can be collapsed and expanded depending on the level of detail you’re looking for. But especially the filters All, Issues and Errors become handy when looking for a test failure or a build error.
Sometimes you need to dig even deeper using your favorite text editor or you just want to download some Integration assets (like the built Xcode Archive). In that case, click Download Logs…, which will get you the whole zipped output of the Integration.
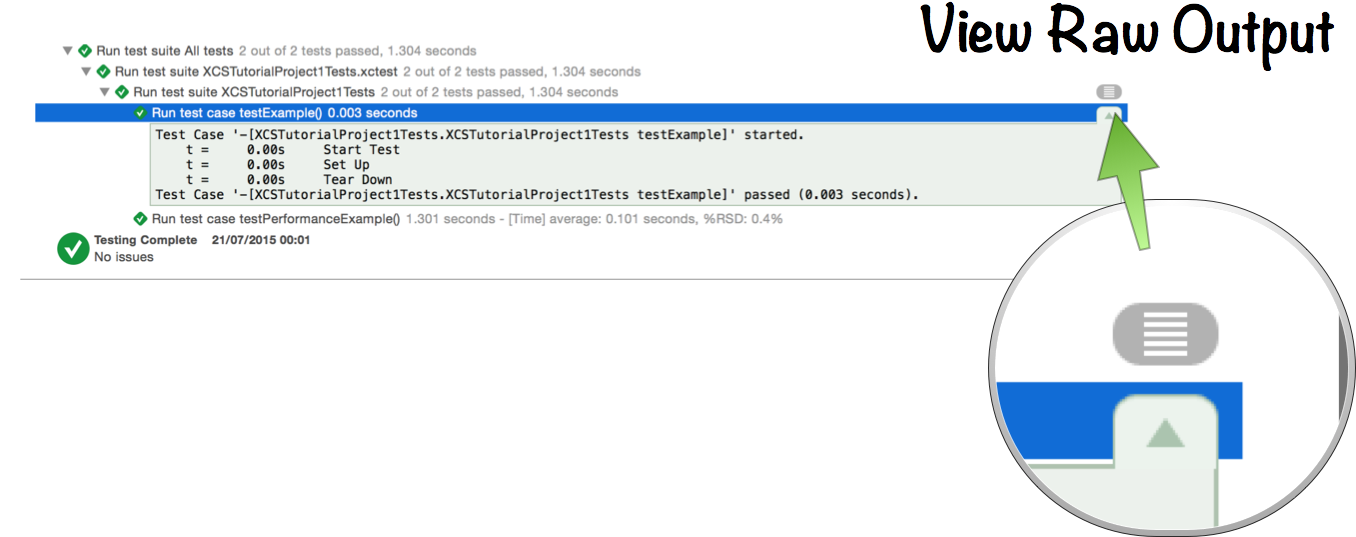
There is also a bit of a hidden feature: when you’re interested in the raw output of a command, just hover over the right side of it to reveal a “hamburger”🍔 button. Clicking it will present you with the raw, unformatted output. Handy!
2. Web UI
Now, there is one more visual way to access Bots and Integrations, and that is in your second most used app: your web browser. Just navigate to https://127.0.0.1/xcode to find a list of your Bots. If you click on one, you can see its latest Integration. Neat, huh?
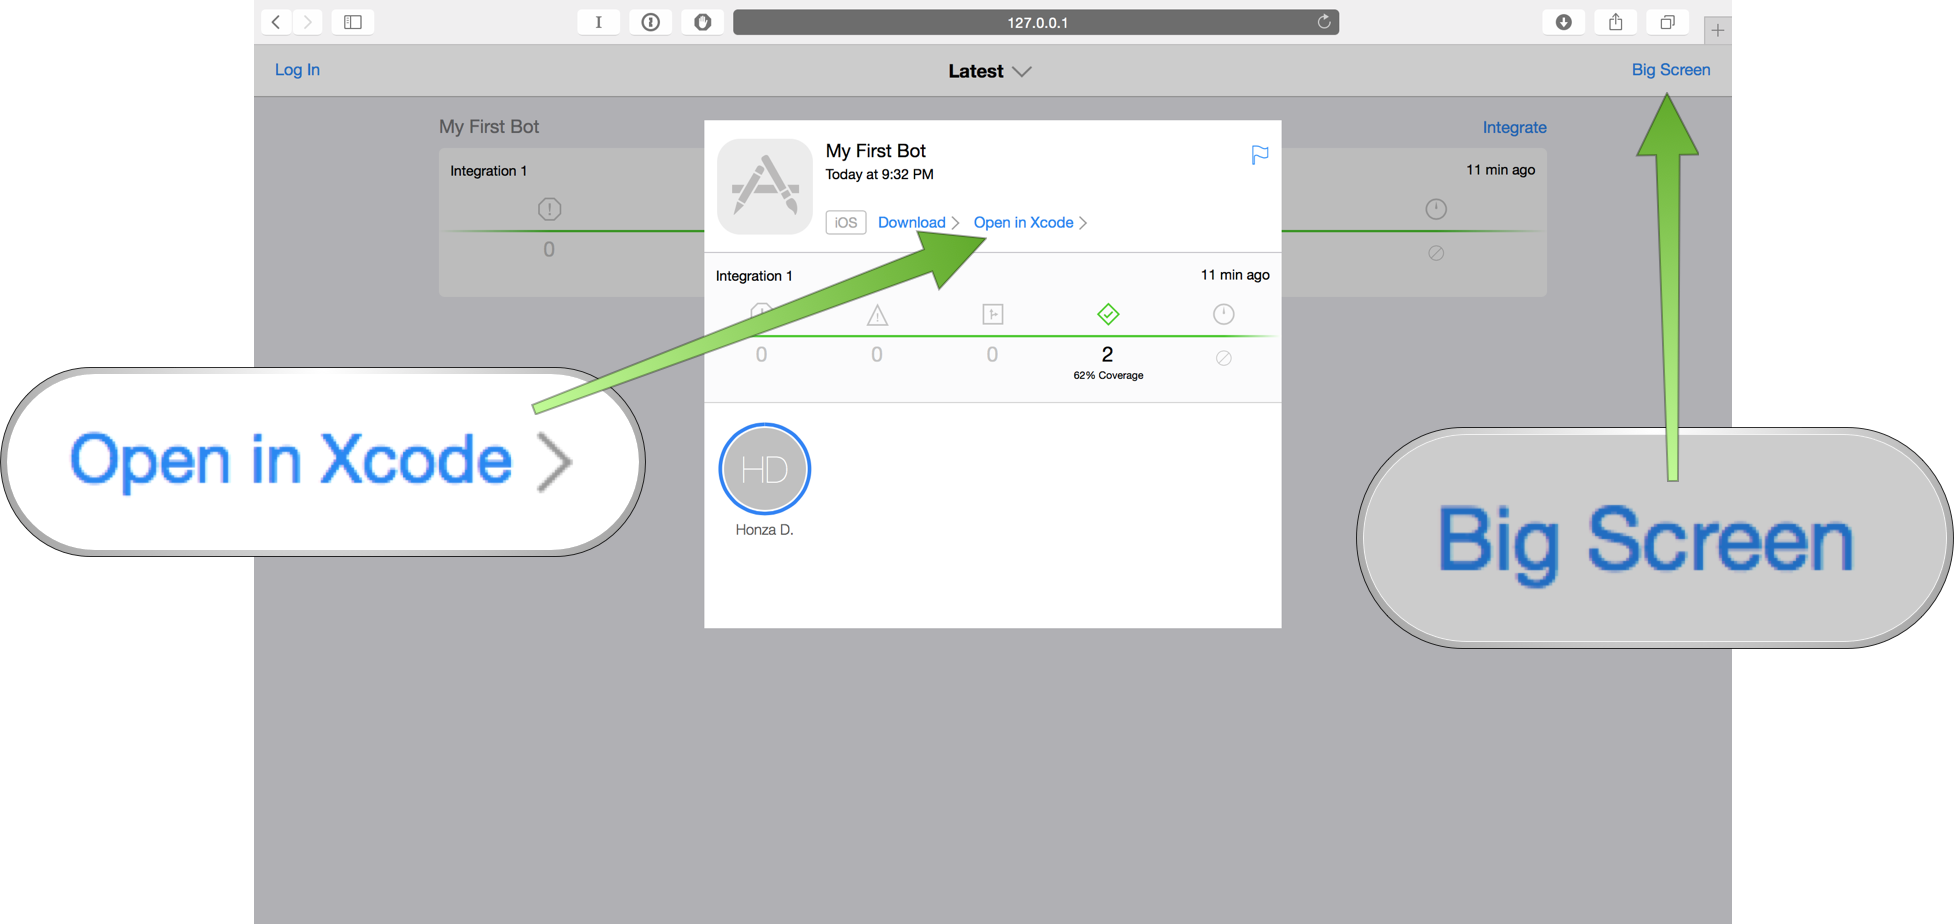
What’s also nice is that you can jump directly to Xcode’s Integration results by clicking on the “Open in Xcode” link (usually works). And last but definitely not least, let’s take a look at the Big Screen.
Do you ever envy web developers with their huge and important-looking dashboards? Well, you just got yourself one as well! Just click on “Big Screen” and behold the beauty below. ✨
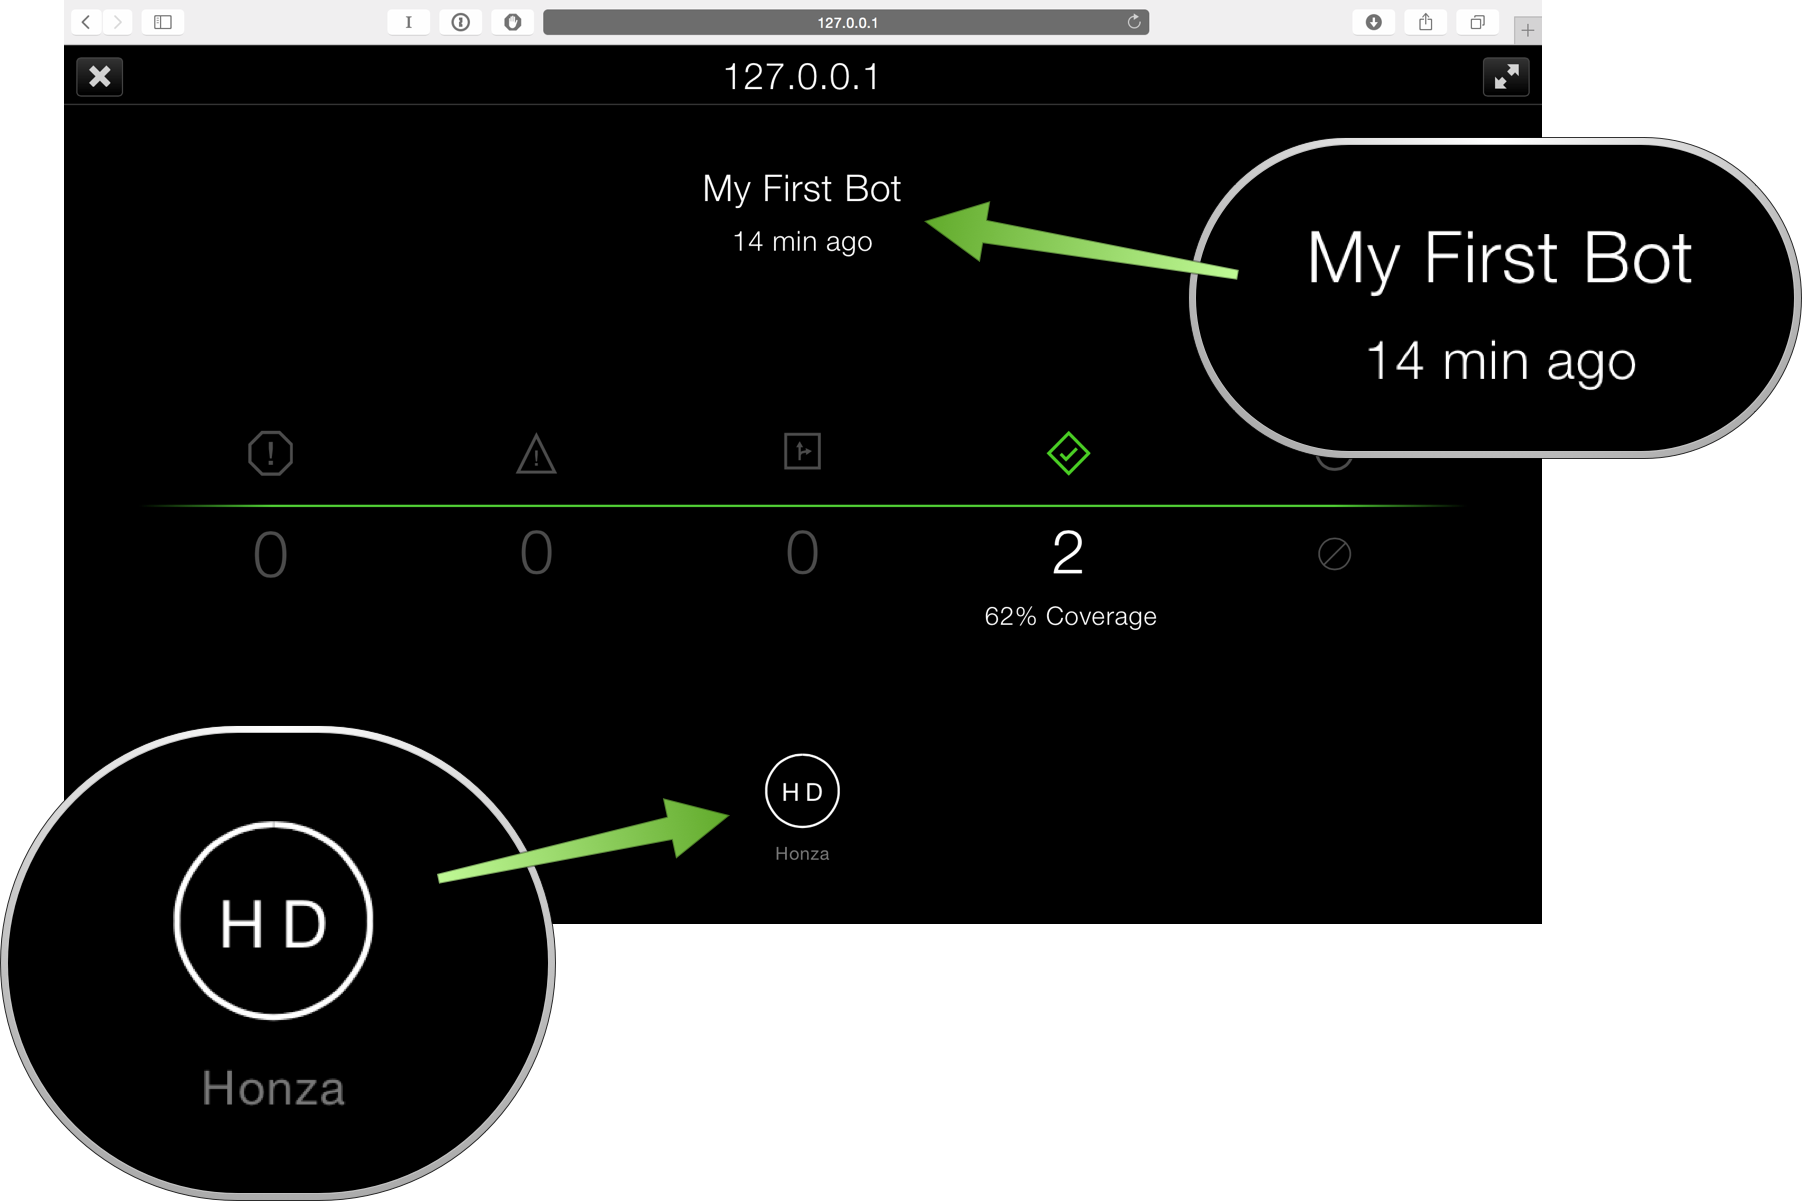
The Big Screen is definitely one of the better designed UIs from Apple. Putting it up on a huge TV screen in your office ensures that nobody wants to break the build, because The Big Screen™ will publicly shame them by pointing out who the latest committers to your repo were (bottom of the screen). In addition, it tells you when the your Bot’s latest Integration ran (14 minutes ago in our case). Also, this screen scales really nicely when you have like five Bots, by alternating between them with a smooth animation.
This is all for today. Great job, you! You can now look at results in Xcode and intelligently analyze and discuss what the build did and didn’t. Plus, in Part 1, you learned how to set up Xcode Server from scratch, so feel free to add “sysadmin” to your LinkedIn profile now 😉
I have many more tutorials planned - but feel free to ping me on Bluesky what you’d like to learn about next. Spoiler alert: Part 3 of this tutorial will go into prebuild and postbuild scripts - how to add fastlane, CocoaPods, Carthage and any custom actions around your builds. We’ll get to know the mysterious _xcsbuildd user haunting your system and we’ll even learn how to integrate private CocoaPods, which has became sort of an “advanced” topic in our community. So stay tuned and see you next time! 👾
I hope you found this useful or interesting. For criticism, praise and future articles, I’m @czechboy0.dev on Bluesky.